۱۳۹۱ مرداد ۱۳, جمعه

Satellites Observe Widespread Melting Event on Greenland


Nearly the entire ice sheet covering Greenland—from its thin coastal edges to its two-mile-thick center—experienced some degree of melting for several days in July 2012. According to measurements from three satellites and an analysis by NASA and university scientists, an estimated 97 percent of the top layer of the ice sheet had thawed at some point in mid-July, the largest extent of surface melting observed in three decades of satellite observations.
The data visualization above shows the extent of surface melting in Greenland on July 8 (left) and July 12, 2012 (right). The maps are based on observations from the Special Sensor Microwave Imager/Sounder (SSMI/S) on the U.S. Air Force’s DMSP satellite, from India’s OceanSat-2, and from the Moderate Resolution Imaging Spectroradiometer(MODIS) on NASA’s Terra and Aqua satellites. The satellites measure different physical properties at different scales, and they pass over Greenland at different times. Taken together, they provide a picture of an extreme melt event.
On July 8, satellites showed that about 40 percent of the ice sheet had undergone thawing at or near the surface. By July 12, the extent of melting spread dramatically beyond the norm. In the images above, areas classified as “probable melt” (light pink) correspond to sites where at least one satellite detected surface melting. Areas classified as “melt” (dark pink) correspond to sites where two or three satellites detected melting.
Every summer, a fraction of the surface of the Greenland ice sheet naturally melts. At high elevations, most melt water quickly refreezes in place. Near the coast, some of the melt is retained by the ice sheet and the rest is lost to the ocean.
In mid-July 2012, Son Nghiem of NASA’s Jet Propulsion Laboratory was analyzing radar data from the Indian Space Research Organisation’s Oceansat-2 satellite when he noticed that most of Greenland appeared to have undergone surface melting on July 12. “This was so extraordinary that at first I questioned the result,” said Nghiem. “Was this real or was it due to a data error?”
Nghiem consulted with Dorothy Hall, who studies the surface temperature of Greenland from NASA’s Goddard Space Flight Center. She confirmed that MODIS showed unusually high temperatures over the ice sheet surface and that melt was extensive. Colleagues Thomas Mote of the University of Georgia and Marco Tedesco of the City University of New York also confirmed the melt with passive-microwave data from the DMSP.
The extreme melting coincided with an unusually strong ridge of warm air—a “heat dome”—over Greenland. The ridge was one in a series that dominated Greenland’s weather between May and July 2012.
Even the area around Summit Station in central Greenland, which at two miles above sea level is near the highest point of the ice sheet, showed signs of melting. A National Oceanic and Atmospheric Administration weather station at Summit confirmed that air temperatures hovered above or within a degree of freezing for several hours from July 11 to July 12.
Such pronounced melting at Summit and across the ice sheet has not occurred since 1889, according to ice cores analyzed by Kaitlin Keegan at Dartmouth College. “Ice cores from Summit show that melting events of this type occur about once every 150 years,” said Lora Koenig, a NASA scientist and member of the team analyzing the satellite data. “With the last one happening in 1889, this event is right on time. But if we continue to observe melting events like this in upcoming years, it will be worrisome.”
“The Greenland ice sheet is a vast area with a varied history of change,” said Tom Wagner, NASA’s cryosphere program manager. “This event, combined with other natural but uncommon phenomena such as the large calving event earlier this week on Petermann Glacier, are part of a complex story.”


The Lights of London


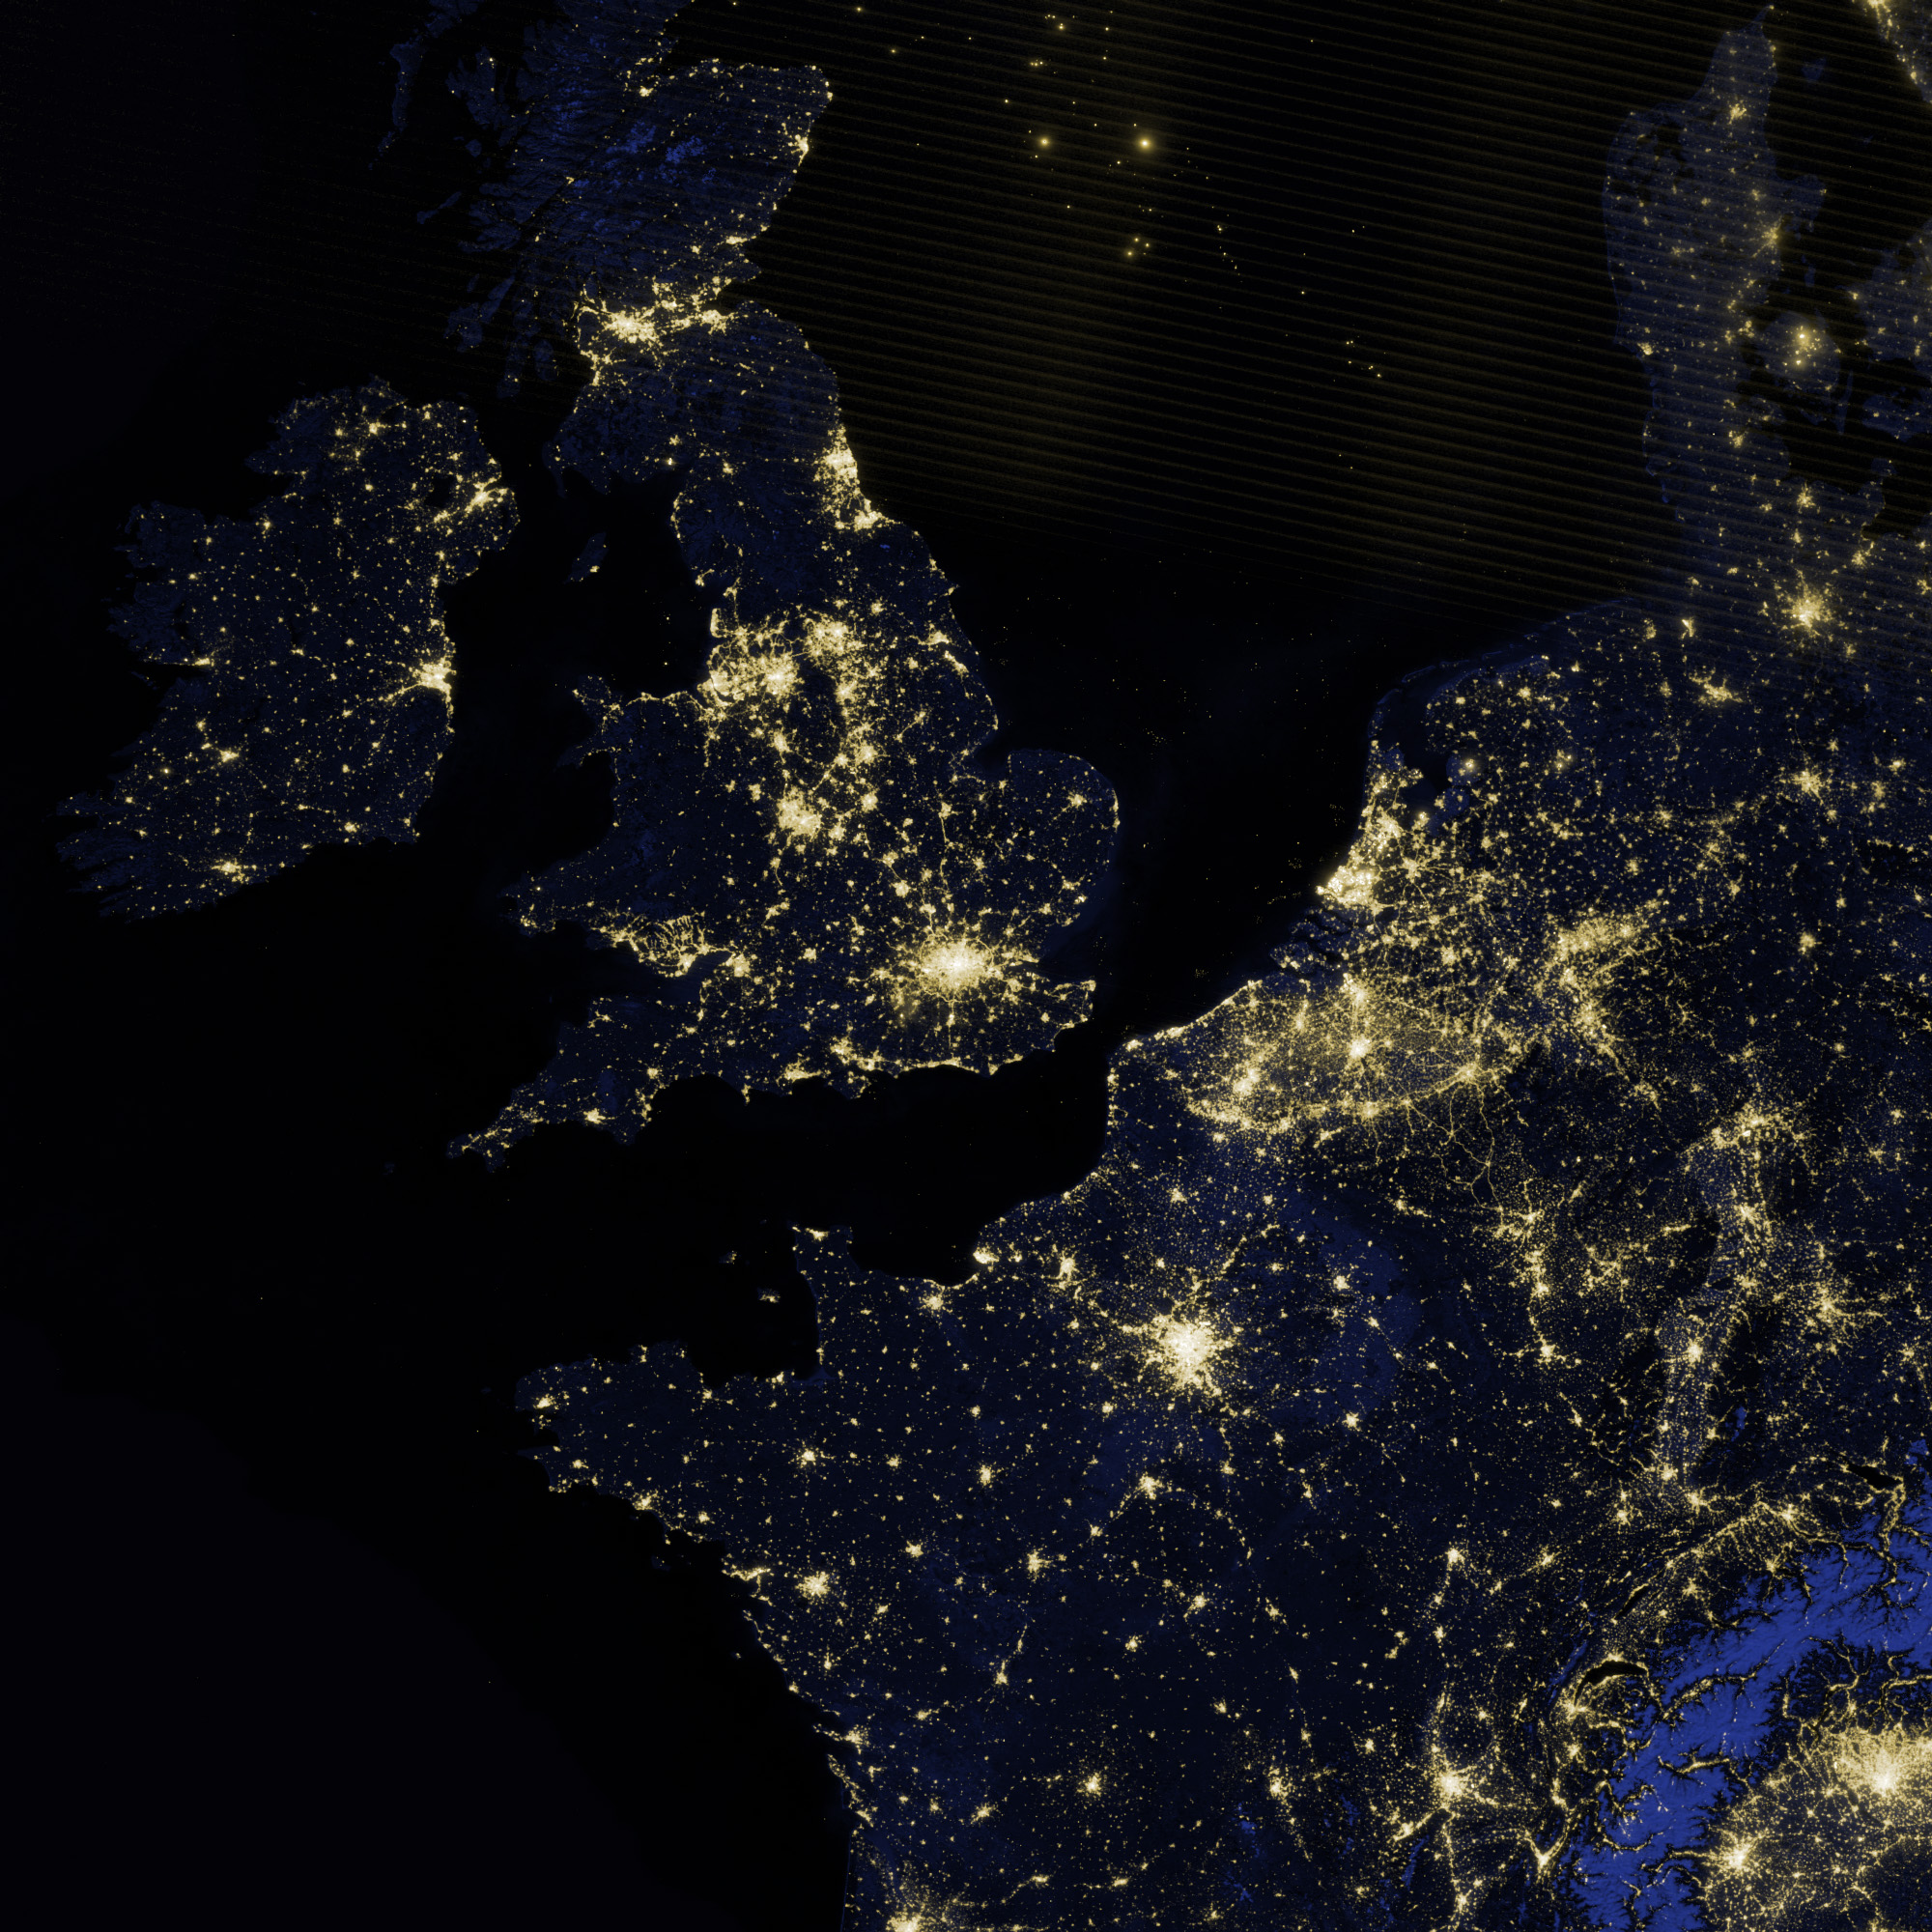
Billions of people will see London through many different filters and lenses during the 2012 Olympic Games and Paralympic Games. None of those views will look quite like this one from the Suomi National Polar-orbiting Partnership satellite.
The image above shows London and the southern half of Great Britain as it appeared on the night of March 27, 2012. While most of the events in the 2012 Olympics will be held in the greater London area, several other cities and towns will host events, including: canoeing at Lee Valley White Water Center; sailing in Portland Harbour; rowing and canoeing at Eton Dorney; and cycling and mountain bike events at Hadleigh Farm.
The image was acquired by the Visible Infrared Imaging Radiometer Suite (VIIRS) on Suomi NPP, which includes a “day-night band” similar to images collected by the Operational Linescan System (OLS) flown on U.S. Defense Meterological Satellite Program (DMSP) satellites.
The day-night band observes light in a range of wavelengths from green to near-infrared, and uses light intensification to enable the detection of dim signals, according to Chris Elvidge, who leads the Earth Observation Group at NOAA’s National Geophysical Data Center and works on the VIIRS team.
“In wavelength-speak, the range for visible light is about 400 (blue light) to 700 (red light) nanometers, and the day/night band’s sensitivity is 500 to 900 nanometers,” said Steve Miller, a researcher in the Cooperative Institute for Research in the Atmosphere at Colorado State University. “There are a lot of satellites up there with sensitivity to this same range, but the special thing about the day/night band is its high sensitivity to very low amounts of this light. It can sense light 100,000 times fainter than the conventional visible light sensors. That makes it very sensitive to things like moonlight, city lights, among many other things.”
The night views of Earth are more than just a novelty. “Nightime lights are the least ambiguous remote sensing observation indicating the presence and magnitude of human activities and the density of development,” said Elvidge. Seeing Earth’s night lighting has practical applications in studying human populations, economic activity, habitat fragmentation and encroachment, and energy use. “We can actually look at cities and tell you how much energy is emanating from them,” Miller added, “something pretty useful for energy consumption studies.”
Other scientists use the nighttime views to choose sites for astronomical observatories, study the impact of nocturnal lighting, and to monitor power outages and natural disasters. In meteorology, the combination of VIIRS nighttime views and thermal imaging is valuable for things like differentiating high clouds from low clouds from fog banks.
Suomi NPP was launched from Vandenberg Air Force Base on October 28, 2011, and is the result of a partnership between NASA, the National Oceanic and Atmospheric Administration, and the Department of Defense.
Editor's Note: In the large image (below the main image), the lights in the Irish Sea, the English Channel, and the North Sea are likely a blend of fishing vessels and flares from offshore oil and gas platforms.
  1. Related Reading

  2. London 2012 Olympic and Paralympic Games (n.d.) Interactive Map–2012 Olympics. Accessed July 25, 2012.
  3. NASA (n.d.) Suomi NPP. Accessed July 25, 2012.
  4. NASA Earth Observatory (2008, April 22) Cities at Night: The View from Space.

Carbon Eaters on the Black Sea


This brilliant cyan pattern scattered across the surface of the Black Sea is a bloom of microscopic phytoplankton. The multitude of single-celled algae in this image are most likely coccolithophores, one of Earth’s champions of carbon pumping. Coccolithophores constantly remove carbon dioxide from the atmosphere and slowly send it down to the seafloor, an action that helps to stabilize the Earth's climate.
This image of this swirling blue bloom was captured on July 15, 2012, by the Moderate Resolution Imaging Spectroradiometer (MODIS) on NASA’s Aqua satellite. Note that the image is rotated so that north is to the right. Ocean scientist Norman Kuring of NASA’s Goddard Space Flight Center suggested the bloom was likely Emiliania huxleyi, though it is impossible to know the species for sure without direct sampling of the water.
Coccolithophores use carbon, calcium, and oxygen to produce tiny plates of calcium carbonate (coccoliths). Often called “stones” by researchers, coccoliths resemble hubcaps. During their lifespan, coccolithophores remove carbon from the air, “fix” or integrate it into what is effectively limestone, and take it with them to the seafloor when they die and sink or when they are consumed (and eventually excreted) by zooplankton and fish.
These micro-stones are thought to speed up the ocean’s biological pump, according to William Balch, a senior research scientist at the Bigelow Laboratory for Ocean Sciences and a member of the Suomi NPP science team. Without this dense calcium carbonate ballast for sinking particles to the depths, less carbon dioxide would be drawn down into the ocean. The net result would be higher atmospheric concentrations of carbon dioxide.
But as Balch points out, the ever-increasing amount of carbon dioxide in our air could upset this biological pump. Excess carbon dioxide is making the ocean more acidic, which may change the conditions that promote coccolithophore growth. “Ocean acidification is highly relevant to coccolithophores,” said Balch. “We are trying to understand if it would slow the ocean’s biological pump by inhibiting coccolithophore calcification. If they can’t calcify, they can’t make their limestone plates that pull all the sinking particulate carbon to the seafloor.”

Mine Collapse in Turkey


At 10 a.m. on February 10, 2011, disaster struck the Çöllolar coalfield in central Turkey, near the city of Elbistan. The northeastern wall of an open-pit mine collapsed, sending about 50 million tons of material into the mine. The debris buried and killed ten workers.
The collapse was the second at the same mine within a week. Four days earlier, a smaller landslide damaged the opposite wall and killed one person. According to a United Nations report, debris from the two landslides covered 2.73 square kilometers (1 square mile). The larger landslide extended 350 meters (1,150 feet) past the original perimeter of the pit. Inadequate drainage of the mine walls likely caused the landslides, according to Caner Zanbak, an environmental adviser to the Turkish Chemical Manufacturers Association.
The Advanced Land Imager (ALI) on NASA’s Earth Observing-1 (EO-1) satellite acquired this view of the landslide’s aftermath on June 7, 2011. Material from both landslides is visible in the mine pit on the left side of the image. See this blog post for a detailed satellite view of the boundary between the two debris fields. An aerial photograph of the two landslides is available here. The pit on the far right of the image is the Kislaköy mine, which was damaged in 2006 by a landslide.
The material mined at the Çöllolar coalfield is lignite, a brown type of coal that is generally younger and softer than bituminous or anthracite. Turkey relies on lignate for 21 percent of its electric power production, and the Afsin-Elbistan lignite basin contains about half of Turkey’s lignate reserves.
Turkey has the highest fatality rate for miners in the world, with 133 deaths for every 100,000 miners in Turkey, according to data released in 2011. As of June 19, 2012, the Çöllolar coalfield was still closed pending the outcome of a lawsuit. The bodies of nine of the workers killed had not yet been recovered from the debris.

Dust Storm over the Persian Gulf


On June 2, 2012, a dust storm struck southeastern Iraq. Winds blew fine sediments toward the southeast, over the Persian Gulf, and into northeastern Saudi Arabia. Winds also kicked up streamers of dust in Qatar. The Moderate Resolution Imaging Spectroradiometer (MODIS) on NASA’s Aqua satellite captured this natural-color image the same day.
Although most of the countries affected by the dust enjoyed some clear skies outside of the storm, dust completely obliterated Kuwait. On June 4, Kuwait Times reported that the storm had paralyzed the country, with visibility reduced to less than 500 meters (1,600 feet). Dust storm activity was expected to continue, although it was expected to benefit residents by lowering recent high temperatures.
  1. References

  2. Fattahova, N. (2012, June 4) Activities paralyzed as dust storm hits Kuwait - Weather to help reduce temperature.Kuwait Times. Accessed June 4, 2012.

Dust Storm over Afghanistan, Pakistan, and Iran


A dust storm stirred in the Hamun wetlands along the Iran-Afghanistan border on June 3, 2012. By the following day, the dust plumes had grown, spreading far south into Pakistan. The Moderate Resolution Imaging Spectroradiometer(MODIS) on NASA’s Aqua satellite acquired this natural-color image on June 4.
When moisture is scarce, areas like the Hamun wetlands transform to dry lakebeds, and the fine sediments provide material for dust storms. Multiple dry lakebeds occur along the borders between Iran, Afghanistan, and Pakistan, in addition to the Hamun wetland area. High temperatures can also contribute to dust storms by making air near the ground unstable. In such conditions, even light winds can loft dust into the air.
  1. References

  2. University Corporation for Atmospheric Research. Forecasting Dust Storms. (Registration required).

Dust over Iraq and Iran


The dust that blew over Syria and Iraq on June 18, 2012, continued its southeastward journey the following day. On June 19, the dust had spread to western Iran and the Persian Gulf.
This natural-color image from the Moderate Resolution Imaging Spectroradiometer (MODIS) on NASA’s Aqua satellite shows a camel-colored plume curving eastward along the Iraq-Iran border. That plume is thick enough to completely hide the land and water surfaces below. Thinner dust hovers over the Persian Gulf.